'One Year. Real Results.': Taking Credit for Biden-Era Progress and Making False Economic Claims
Why This Matters for NY-23
When representatives claim credit for economic trends that began before their policies took effect, constituents can’t accurately evaluate those policies. Inflation fell from 9.1% to 2.6% during the Biden administration — before Trump took office. Claiming “real results” for trends already underway misleads voters about cause and effect. And some claims in this post — like “largest tax cut in history” — are flatly false when measured against prior tax cuts.
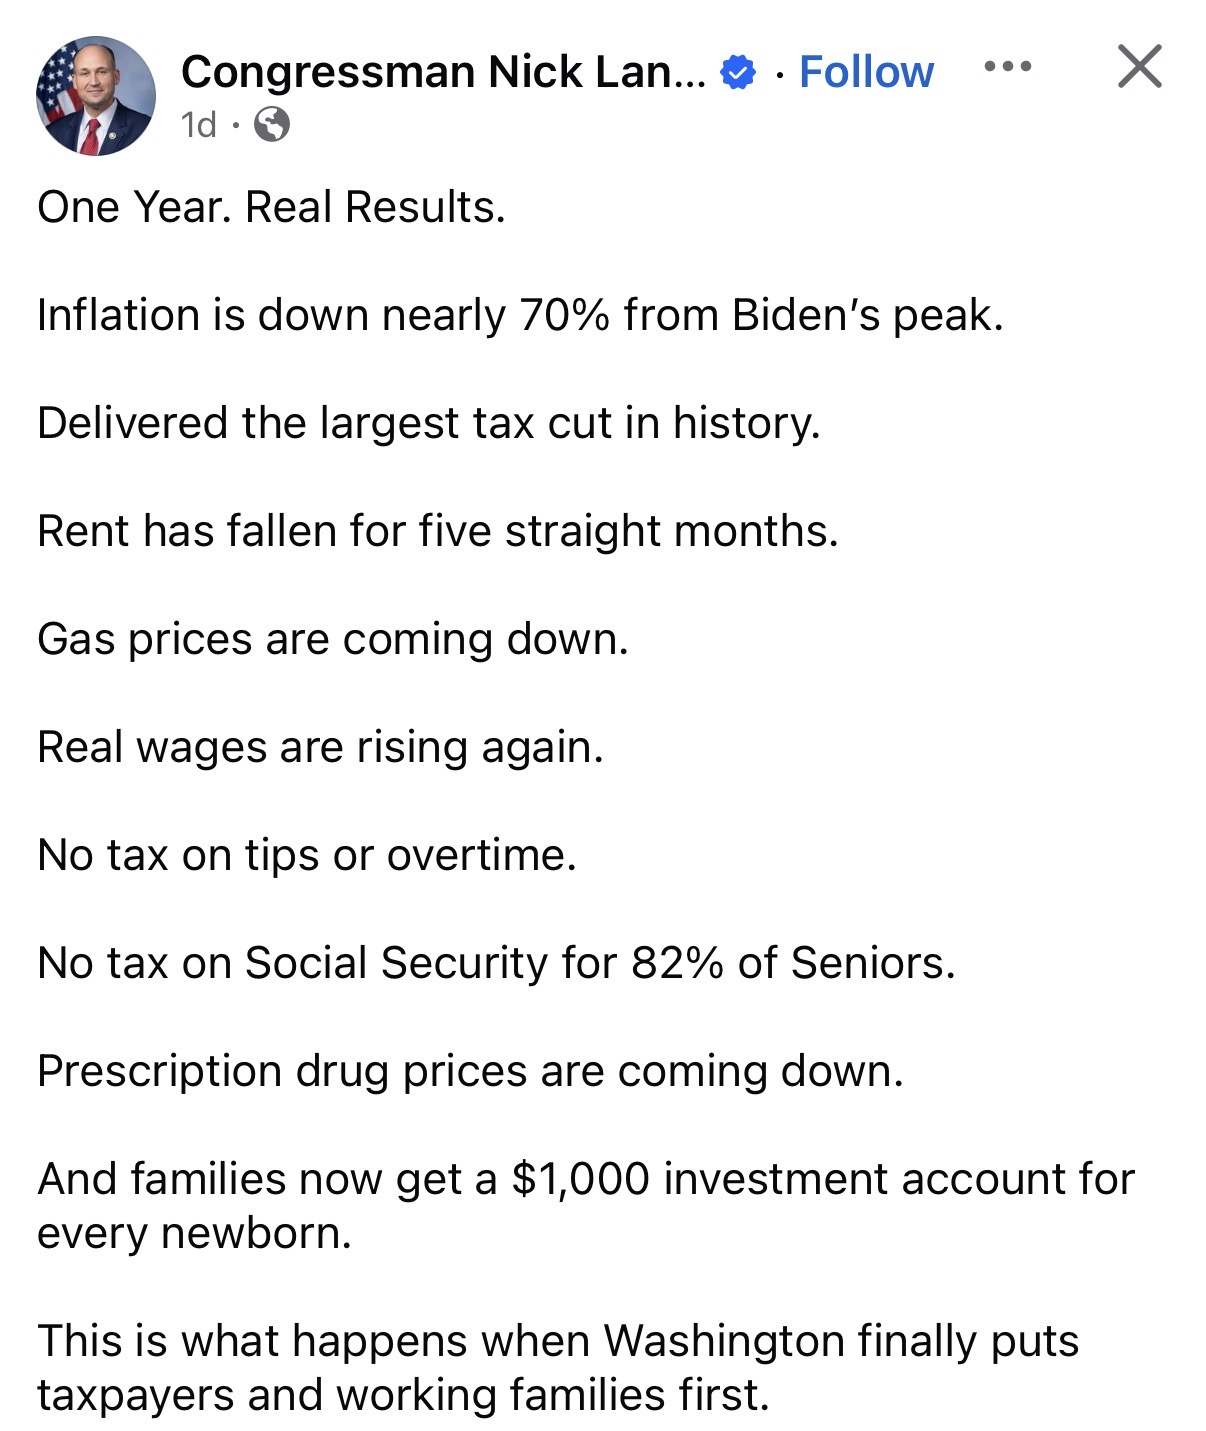
Langworthy’s Facebook post claiming Trump administration economic achievements (screenshot archived January 22, 2026)
Statement
Source: Facebook Post Posted by: Congressman Nick Langworthy (verified account) Date: Approximately January 21, 2026
“One Year. Real Results.
Inflation is down nearly 70% from Biden’s peak.
Delivered the largest tax cut in history.
Rent has fallen for five straight months.
Gas prices are coming down.
Real wages are rising again.
No tax on tips or overtime.
No tax on Social Security for 82% of Seniors.
Prescription drug prices are coming down.
And families now get a $1,000 investment account for every newborn.
This is what happens when Washington finally puts taxpayers and working families first.”
Claim-by-Claim Analysis
1. “Inflation is down nearly 70% from Biden’s peak”
Verdict: MISLEADING ATTRIBUTION
The Math:
- Biden’s peak inflation: 9.1% (June 2022)
- Current inflation: 2.8% (November 2025)
- Calculation: (9.1 - 2.8) / 9.1 = 69.2% - “nearly 70%” is accurate
The Problem:
This decline occurred over 3.5 years from June 2022 to November 2025.
During Trump’s first year (Jan 2025 - Jan 2026):
- Starting point: ~2.7-2.8%
- Ending point: 2.8%
- Actual change: Essentially flat (maybe 0.1 percentage point)
What Langworthy did: Took credit for inflation decline that occurred during Biden’s presidency, framing it as “One Year. Real Results.” from Trump.
2. “Delivered the largest tax cut in history”
Verdict: MISLEADING WITHOUT CONTEXT
Nominal dollars: The One Big Beautiful Bill Act (OBBB/H.R. 1) has an estimated 10-year cost of $3.8-4.5 trillion according to preliminary CBO/JCT scoring. This is the largest in nominal dollar terms.
But by the measure that matters (% of GDP):
| Tax Cut | 10-Year Cost (% of GDP) | Nominal $ |
|---|---|---|
| Reagan 1981 (ERTA) | 2.89% | ~$750B (1981 dollars) |
| Trump 2017 (TCJA) | 0.90% | ~$1.5T |
| OBBB 2025 | ~1.2-1.5% | ~$4T |
By the economically meaningful measure (GDP share), Reagan’s 1981 tax cut remains the largest.
Update: “Your First $31,500 Is Tax Free” (February 2026)
Verdict: MISLEADING
On February 10, 2026, Langworthy posted a “Working Families Tax Cuts” graphic claiming: “Your first $31,500 is tax free! Thanks to an increased standard deduction for families.”
What this is: The $31,500 is the 2025 standard deduction for married couples filing jointly under the OBBBA. For 2026, it rises to $32,200 with inflation adjustment.
What Langworthy omits:
| What he implies | What actually happened |
|---|---|
| OBBBA created a new $31,500 tax-free threshold | The 2025 standard deduction was already $30,000 before OBBBA. The actual increase is $1,500 for joint filers. |
| This is a new “Working Families Tax Cut” | The nearly-doubled standard deduction was created by the 2017 Tax Cuts and Jobs Act — 6 years before Langworthy’s OBBBA vote. OBBBA made it permanent and added $1,500. |
| Families keep $31,500 “tax free” | Payroll taxes (Social Security and Medicare, ~7.65%) still apply to every dollar of earned income regardless of the standard deduction. A family earning $31,500 still pays ~$2,410 in payroll taxes. |
The $1,500 difference: For a married couple in the 12% bracket, the OBBBA’s additional $1,500 standard deduction saves approximately $180 per year — about $15 per month. The other $30,000 was already law.
If the TCJA had expired (as originally scheduled at the end of 2025), the standard deduction would have reverted to approximately $16,525 for joint filers, and personal exemptions (~$5,275 per person) would have returned. So the real policy question was whether to extend existing law or let it expire — not whether to create a new tax cut.
In plain language: Langworthy is presenting the entire standard deduction — most of which has been in place since 2018 — as a new “Working Families Tax Cut.” The OBBBA’s actual contribution is $1,500 on top of what was already law. That’s $15/month for a family in the 12% bracket. And payroll taxes still apply to every dollar.
3. “Rent has fallen for five straight months”
Verdict: FALSE
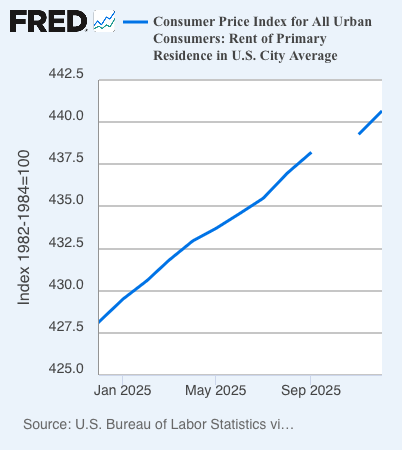
BLS data via FRED shows rent index continuously INCREASED throughout 2025, contradicting Langworthy’s claim
The claim: Rent prices have experienced actual month-over-month decreases (deflation) for five consecutive months.
The official data:
Source: Federal Reserve Economic Data (FRED), “Consumer Price Index for All Urban Consumers: Rent of Primary Residence in U.S. City Average”
Rent index values:
- January 2025: ~427.5
- May 2025: ~435.0
- September 2025: ~440.0
The chart shows continuous INCREASES throughout 2025, not decreases.
For rent to have “fallen,” the index would need to show NEGATIVE month-over-month changes. The BLS data shows the opposite: steady upward trajectory.
Possible sources of confusion:
- Conflating “slower rate of increase” (disinflation) with actual “decrease” (deflation)
- Using private market data (e.g., Zillow asking rents for new leases) instead of official BLS CPI data
- Referring to specific metro areas rather than national averages
Five consecutive months of rent deflation would be essentially unprecedented in modern CPI history outside of severe economic crises.
4. “Gas prices are coming down”
Verdict: LIKELY ACCURATE (context-dependent)
Gasoline prices are highly seasonal and volatile. Prices typically decline from summer peaks into winter months.
If measured against summer 2025 highs or June 2022 peak (~$5.00/gallon), the claim is likely accurate. This may reflect seasonal patterns rather than policy effects.
5. “Real wages are rising again”
Verdict: LIKELY ACCURATE
Real wages (inflation-adjusted earnings) turned positive on a year-over-year basis in mid-to-late 2023 as inflation subsided below nominal wage growth.
Important context:
- Workers experienced roughly 25 consecutive months of real wage declines during 2021-2022 when inflation outpaced wage growth
- BUT: This recovery began in 2023 under Biden, not in Trump’s first year
6. “No tax on tips or overtime”
Verdict: MISLEADING / OVERSIMPLIFIED
What the OBBB actually does: Creates tax deductions, NOT exemptions or exclusions.
This is a critical distinction:
| Factor | What “No Tax” Implies | What OBBB Actually Does |
|---|---|---|
| Type of benefit | Exemption/exclusion | Deduction (reduces taxable income) |
| Payroll taxes | Would not apply | Still apply (~7.65% for employees) |
| Income tax | Would not apply | Reduced via deduction |
Example: A worker receiving a $1,000 tip does NOT keep the full $1,000 tax-free.
- Payroll taxes (FICA): ~$76.50 still owed
- Income tax: Reduced based on marginal rate (22% bracket = $220 savings, not $1,000)
“No tax” fundamentally mischaracterizes how the provision works.
7. “No tax on Social Security for 82% of Seniors”
Verdict: MISLEADING
What the OBBB actually does: Creates a deduction (up to $6,000 for single filers, $12,000 for married couples), NOT elimination of Social Security taxation.
According to Thomson Reuters Tax & Accounting analysis:
“The One Big Beautiful Bill Act (OBBBA) created a new tax deduction for seniors 65+ starting with the 2025 tax year… is it going to be a complete exclusion? No, it will not.”
Key points:
- This is a deduction, not an exemption
- The long-standing rule that up to 85% of Social Security benefits may be taxable remains in place
- Approximately 40% of Social Security recipients already pay no tax on their benefits under existing law due to low income
8. “Prescription drug prices are coming down”
Verdict: MISLEADING
Two opposing trends occurring simultaneously:
Prices DECREASING (limited scope):
- Medicare negotiated prices for 10 specific drugs took effect in 2026 under the Inflation Reduction Act (passed under Biden)
- Drugs: Eliquis, Jardiance, Xarelto, Januvia, Farxiga, Entresto, Enbrel, Imbruvica, Stelara, NovoLog
Prices INCREASING (broad scope):
- Reuters reported 350+ drugs with price increases effective January 1, 2026
- Median list price increase: 4%
From Reuters (January 1, 2026):
“Drugmakers plan to raise U.S. prices on at least 350 branded medications including vaccines against COVID, RSV and shingles and blockbuster cancer treatment Ibrance, even as the Trump administration pressures them for cuts.”
For most Americans, prescription drug costs are NOT declining.
9. “$1,000 investment account for every newborn”
Verdict: NEEDS VERIFICATION
Reports during OBBB legislative development referenced “MAGA Accounts” (Money Accounts for Growth and Advancement) proposing $1,000 government contributions for newborns. Provision requires verification through Congress.gov and Treasury/IRS implementation guidance.
The Broader Pattern: Biden-Era Progress Rebranded
Inflation Decline Timeline
| Period | Inflation Rate | Administration |
|---|---|---|
| June 2022 | 9.1% (peak) | Biden |
| January 2023 | 6.4% | Biden |
| January 2024 | 3.4% | Biden |
| January 2025 | ~2.7% | Biden to Trump |
| November 2025 | 2.8% | Trump |
| Total decline under Biden | ~6.3 percentage points | |
| Change under Trump (first year) | ~0.1 percentage points |
Langworthy’s post attributes the entire 70% decline to Trump’s first year.
OBBB Context: Tax Policy That Weakens Social Security and Medicare
While claiming “no tax on Social Security,” Langworthy voted for legislation that:
From Committee for a Responsible Federal Budget (CRFB):
“The OBBBA would accelerate Social Security and Medicare insolvency by a year, to 2032… by reducing the revenue collected from the income taxation of Social Security benefits, which is deposited into the Social Security and Medicare trust funds.”
Fact-Check Summary Table
| Claim | Verdict | Explanation |
|---|---|---|
| Inflation down 70% | FALSE ATTRIBUTION | Decline occurred 2022-2025, mostly under Biden |
| Largest tax cut | MISLEADING | Largest in nominal $, NOT as % of GDP |
| Rent fallen 5 months | FALSE | BLS data shows continuous increases throughout 2025 |
| Gas prices down | LIKELY TRUE | Context-dependent, may reflect seasonal patterns |
| Real wages rising | TRUE | But recovery began in 2023 under Biden |
| No tax tips/overtime | MISLEADING | Deduction, not exemption. Payroll taxes still apply |
| No tax Social Security | MISLEADING | Deduction, not elimination |
| Drug prices down | MISLEADING | 10 Medicare drugs decreased, 350+ drugs increased |
| $1,000 newborn accounts | UNVERIFIED | Needs confirmation through official sources |
| “$31,500 is tax free” (Feb 2026) | MISLEADING | $30,000 was already law under TCJA; OBBBA added $1,500 (~$15/mo savings). Payroll taxes still apply |
Questions This Raises
Why frame Biden-era inflation decline as Trump’s “One Year” achievement?
If rent prices continuously increased throughout 2025 per BLS data, where does the “fallen for five straight months” claim come from?
When Langworthy says “no tax” on tips, overtime, and Social Security, why not clarify these are deductions rather than exemptions?
How can prescription drug prices be “coming down” when 350+ drugs increased prices on January 1, 2026?
If the OBBB accelerates Social Security insolvency by reducing trust fund revenue, how does that square with claiming to help seniors?
Why present the entire $31,500 standard deduction as a new “Working Families Tax Cut” when $30,000 of it was already law under the 2017 TCJA?
Sources
Inflation Data
- Bureau of Economic Analysis: Personal Consumption Expenditures Price Index (PCE) - November 2025
- U.S. Bureau of Labor Statistics: Consumer Price Index (CPI) - December 2025
- The New York Times: “Consumer Prices Rose 2.8% Through November” (January 22, 2026)
- CNBC: “Fed’s main gauge shows inflation at 2.8% in November” (January 22, 2026)
Rent Data
- Federal Reserve Economic Data (FRED): Consumer Price Index: Rent of Primary Residence
Tax Cut Analysis / Standard Deduction
- Congressional Budget Office / Joint Committee on Taxation: H.R. 1 Cost Estimate
- Tax Foundation: Historical comparison of major tax legislation; 2026 Tax Brackets and Standard Deduction
- IRS: Tax inflation adjustments for tax year 2026, including OBBB amendments
- Bipartisan Policy Center: The 2025 Tax Debate: Individual Tax Deductions and Exemptions in TCJA
- Langworthy Facebook post: “Working Families Tax Cuts — Your First $31,500 Is Tax Free” (February 10, 2026)
Social Security / Tips / Overtime Provisions
- Thomson Reuters Tax & Accounting: “Breaking down the OBBBA’s Social Security tax deduction” (November 3, 2025)
- Congress.gov: H.R. 1 - One Big Beautiful Bill Act
- Committee for a Responsible Federal Budget: “OBBBA Would Accelerate Social Security and Medicare Insolvency”
Prescription Drug Prices
- Reuters: “Drugmakers raise US prices on 350 medicines despite pressure from Trump” (January 1, 2026)
Note: This entry documents publicly available information from official economic data releases, congressional records, and news reporting. Readers may draw their own conclusions.
Research contribution: Multiple sources including constituent submissions
Last updated: February 10, 2026